Black Friday is the one week of the year when a merchant's payment set-up is tested at full load. What that test shows is usually reported by the provider, not the merchant.
For a few days, every part of the payments stack works at its limit: the merchants checkout flow, the authorisation requests, payment methods, fraud rules, routing and switching between providers. Afterwards, payment service providers (PSPs) publish their records. Volumes, transactions per second, uptime in terms of 99,999%. Merchants are left with a revenue figure and a general sense of how it went.
The more useful question is narrower: how did each provider in the set-up perform under peak load, and what did that performance cost? With 84% of enterprise merchants open to switching PSP and more than half planning a renegotiation or RFP by 2028, Black Friday payments data is the strongest evidence a merchant will hold. It only exists if someone decides what to capture before 27 November.
The first Merchants Pulse survey of 58 enterprise merchants found that 84% are considering switching PSP or keeping the option open. Average PSP satisfaction is still 7.3 out of 10. What keeps merchants in place is operational friction: integration complexity (83%), internal resourcing (66%) and contractual lock-ins (47%).
At the same time, 57% plan a renegotiation or RFP between 2026 and 2028, and rising cost is the most cited reason to act (47%). For many merchants, this Black Friday falls just before those conversations. The data it produces is the strongest input they will have.
Each can be pulled from data merchants already held with their payment services provider(s) or orchestrator. The point is to split it by provider, so a comparison is possible afterwards.
1. Authorisation rates. Approval rates and decline reasons by payment service provider, market and payment method, set against a normal week. Small differences in authorisation rates have a material revenue impact, yet the Merchants Pulse survey found that many merchants lack full visibility of the metric or its financial effect. Peak volume makes the differences large enough to see. Insight into decline reasons might feed into your retry strategies and orchestration settings.
2. Cost of payment acceptance per method. Total cost per successful transaction for each payment method, including payment service provider and processing fees. Start with cards: international cards are accepted by 95% of surveyed merchants and named as strategically important by 78%, so that is where the baseline sits. Then look at the long tail. Merchants accept more than five payment method categories on average but name only three as strategically important: PayPal is accepted by 74% and named by 19%, BNPL is accepted by 64% and named by 12%. Every method carries integration, reconciliation and dispute cost. Peak gives the volume to run a method-level P&L: what each method cost against what it converted. The second Merchants Pulse report, Merchants Are Going Shopping, covers this gap between acceptance and strategic importance.
3. Fraud, false positives and chargebacks as one picture. Blocked fraud is half the result. The other half is the legitimate orders that were declined, and the chargebacks that arrive in the weeks that follow. Fraud and risk tooling is the lowest-scoring PSP capability in the survey, which is why many merchants rely on specialist providers or internal tools. A merchant-side view across all of them is the only complete one.
4. Resilience and routing. Only 19% of enterprise merchants still run a single PSP. 66% are live with or committed to payment orchestration and 73% to multi-acquiring. Yet while 76% built a multi-provider stack for cost optimisation, only 12% have lowest-cost routing in production and 7% use authorisation forwarding. What the stack delivers today is resilience and redundancy. Peak tests that, and shows what routing on cost would have been worth. Record every slowdown: did traffic move, how quickly, and who made the call, what should we optimize in the configuration?
This is the first peak season in which AI shopping agents are part of the forecast. Adobe expects AI-referred visits to US retail sites to rise 130% year on year over November and December, with Black Friday up 95% (Adobe). Salesforce expects AI chat agents to be the source of one in five ecommerce visits this holiday season (Salesforce). During the 2025 holiday season the same traffic grew almost sevenfold and converted 31% better than other sources (Adobe).
Discovery is moving faster than payment. In Deloitte's 2026 holiday survey, 39% of US shoppers named generative AI as their primary tool for at least one shopping task, while 16% would let it complete a purchase (Deloitte). Visa's chief executive described agentic volumes as very small as recently as October. In Europe, Strong Customer Authentication keeps a person in the loop for most agent-assisted purchases. This is consistent with earlier PaymentGenes Consultancy analysis of agentic commerce: the buyer journey changes first, checkout last.
The risk for merchants this peak is less about agents paying and more about agents being turned away. Fraud and bot controls were built to block automation. A legitimate agent comparing prices or filling a basket can look the same as a scraper. In one survey of 500 fraud, risk and security leaders, 31% of organisations block agentic traffic by default (Stellagent). A blocked agent leaves no chargeback and no dispute, so the lost sale does not appear in any payment report.
Three numbers are enough for this year:
Together they show whether the set-up treats agent traffic as a threat, a channel, or both. That is the baseline for deciding how to enable agentic commerce in 2027: through the current payment service provider, a hybrid model that separates agent traffic, or a dedicated agent flow.
Nearly half of enterprise merchants run their entire payments estate with fewer than five dedicated people. During peak, those people are watching dashboards, not writing reports. They also carry a three-year investment agenda of five parallel priorities, each of which becomes an operating requirement the day it goes live.
A review that needs a project team will not happen. One that fits on a page can be agreed in a single meeting before 27 November and filled in the week after.
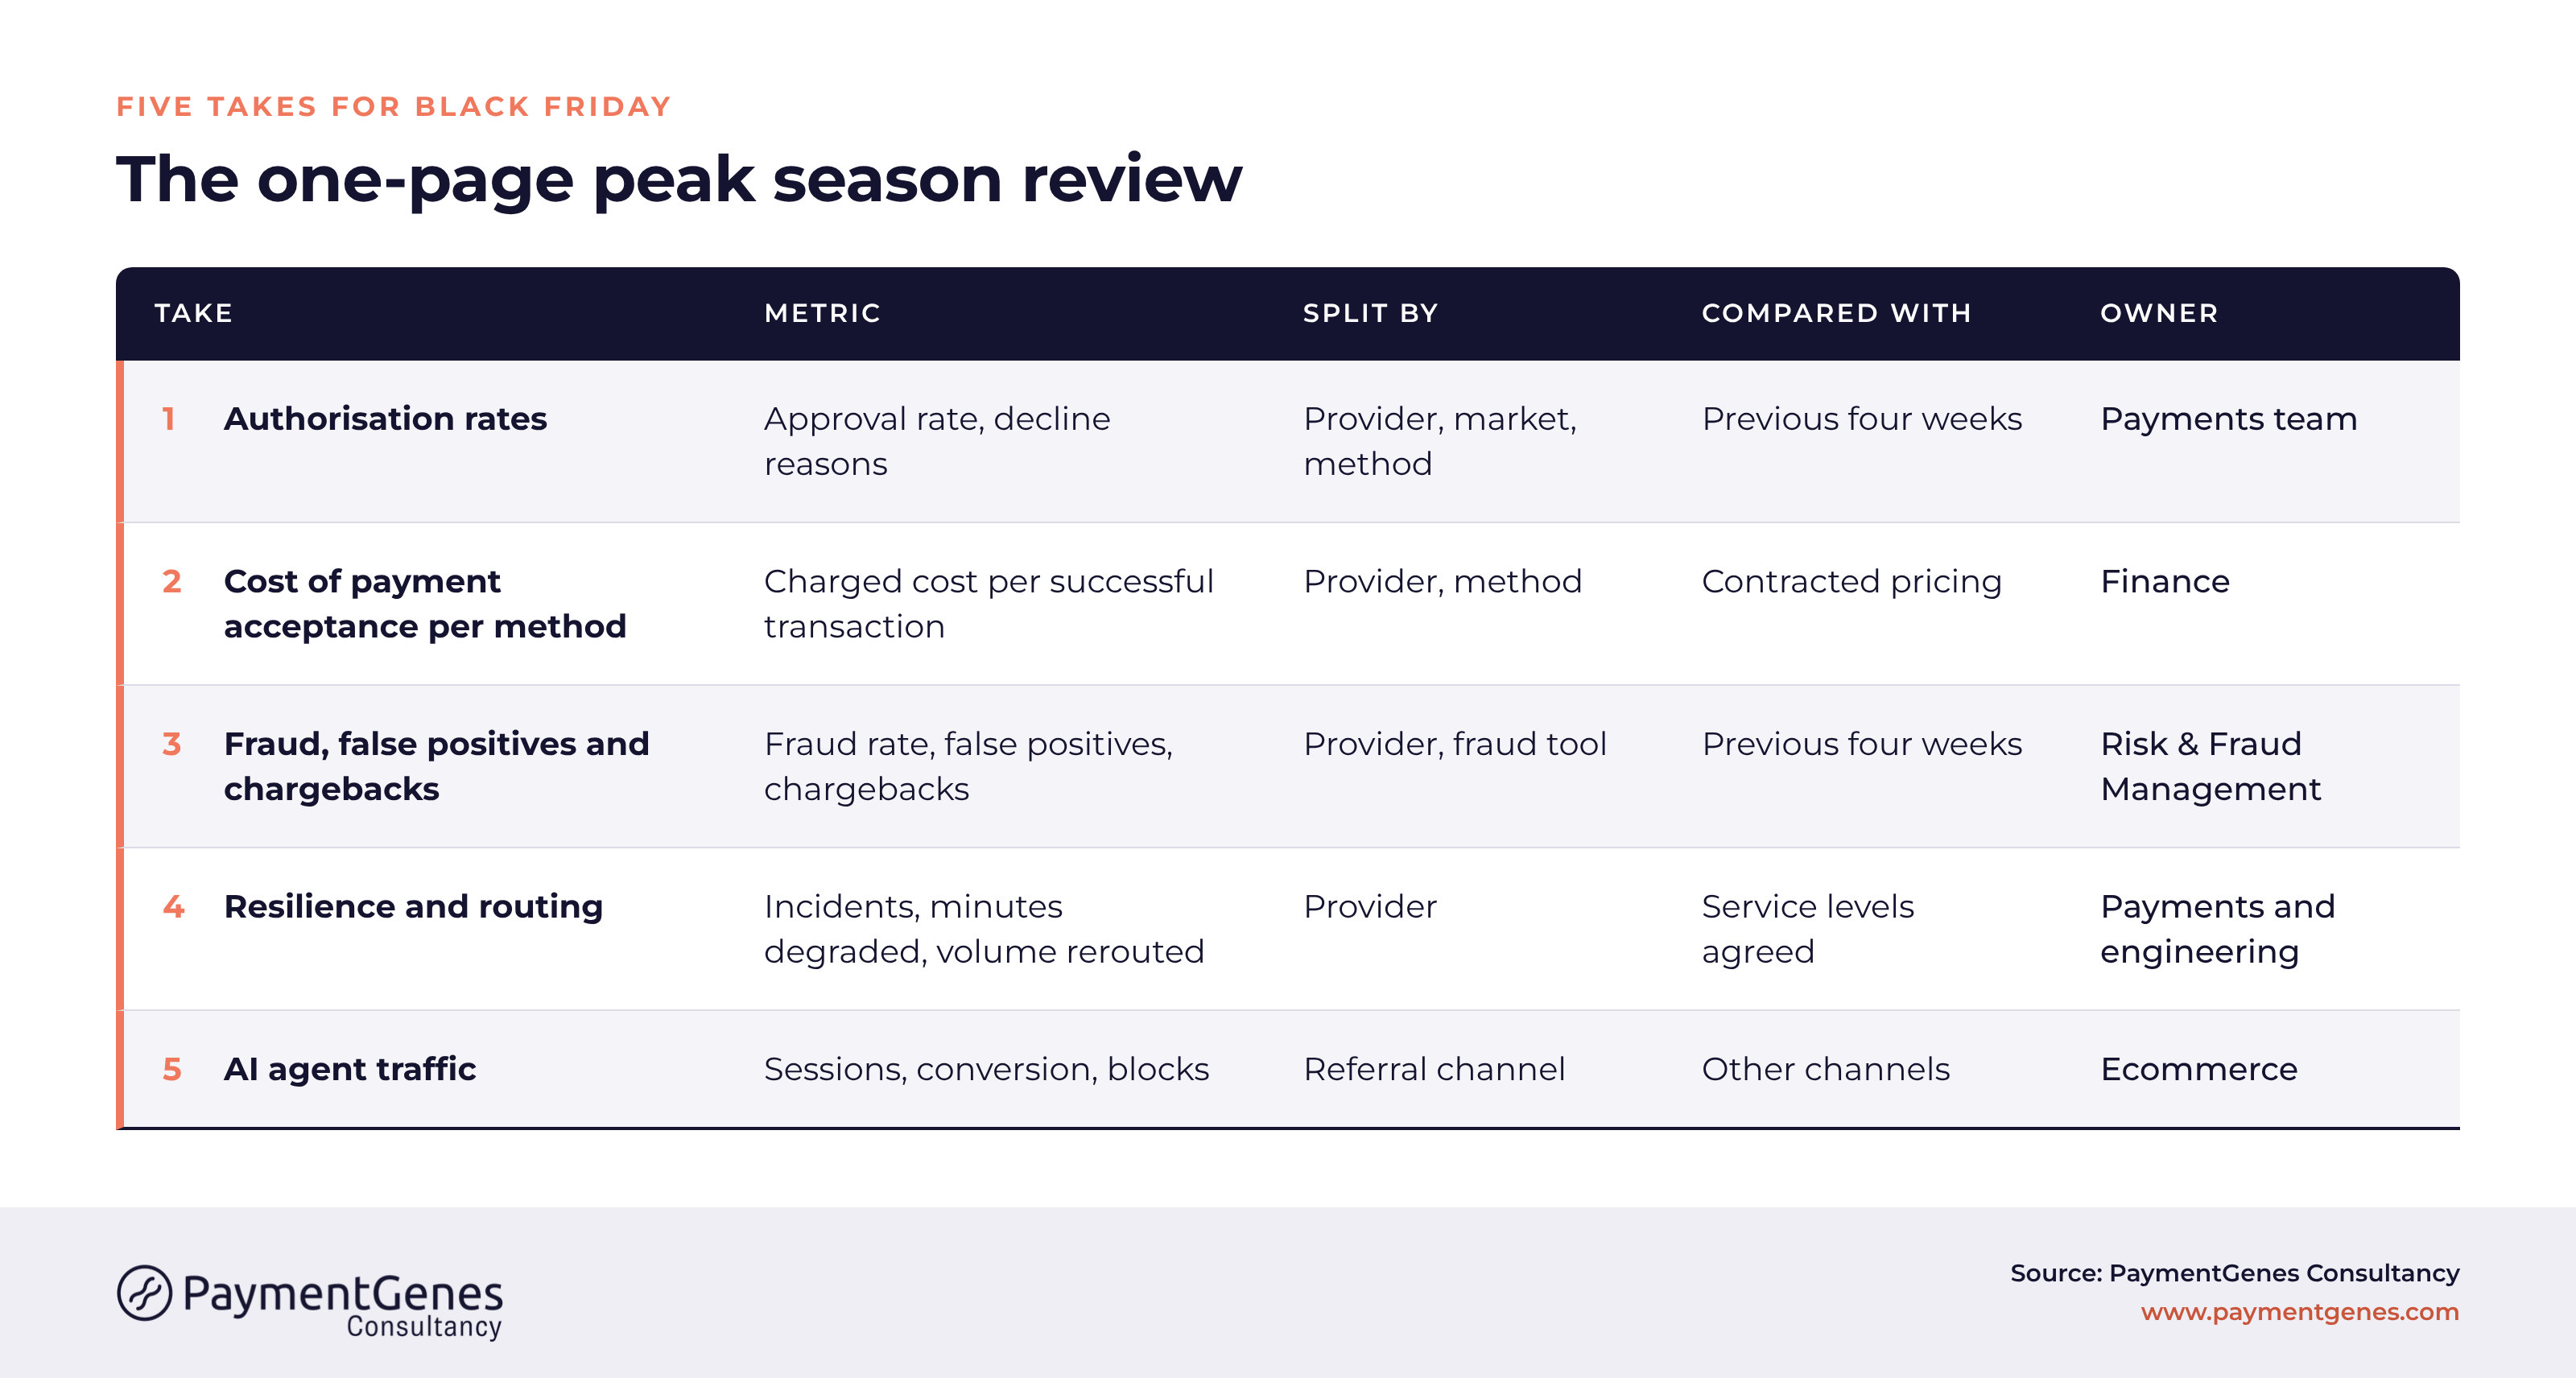
Three rules make the page usable:
Passive waiting is not a strategy. The readings matter because of the decisions they support afterwards. Three steps, in order.
1. Set the cost baseline. Rising cost is the most cited trigger for change (47% of merchants). A cost of conversation without a baseline is a negotiation on the provider's numbers. Peak data gives the total cost of acceptance per provider and per method at the highest volume of the year, which is the figure any renegotiation or RFP should start from.
2. Put a value on performance. Convert each gap into revenue. If one provider approved a higher share of comparable card traffic in the same market, that difference multiplied by volume is the value of routing differently. As an illustration, on €50 millions of peak-week card volume, one percentage point of authorisation rate equals €500,000 in approved sales. The same logic applies to false declines, and to payment methods whose cost exceeds the conversion they add.
3. Define the trigger and choose the route. What would a provider need to deliver to justify a long-term relationship, and which cost threshold, coverage gap or failure would justify a change? With the baseline and the value in hand, the three routes become comparable.
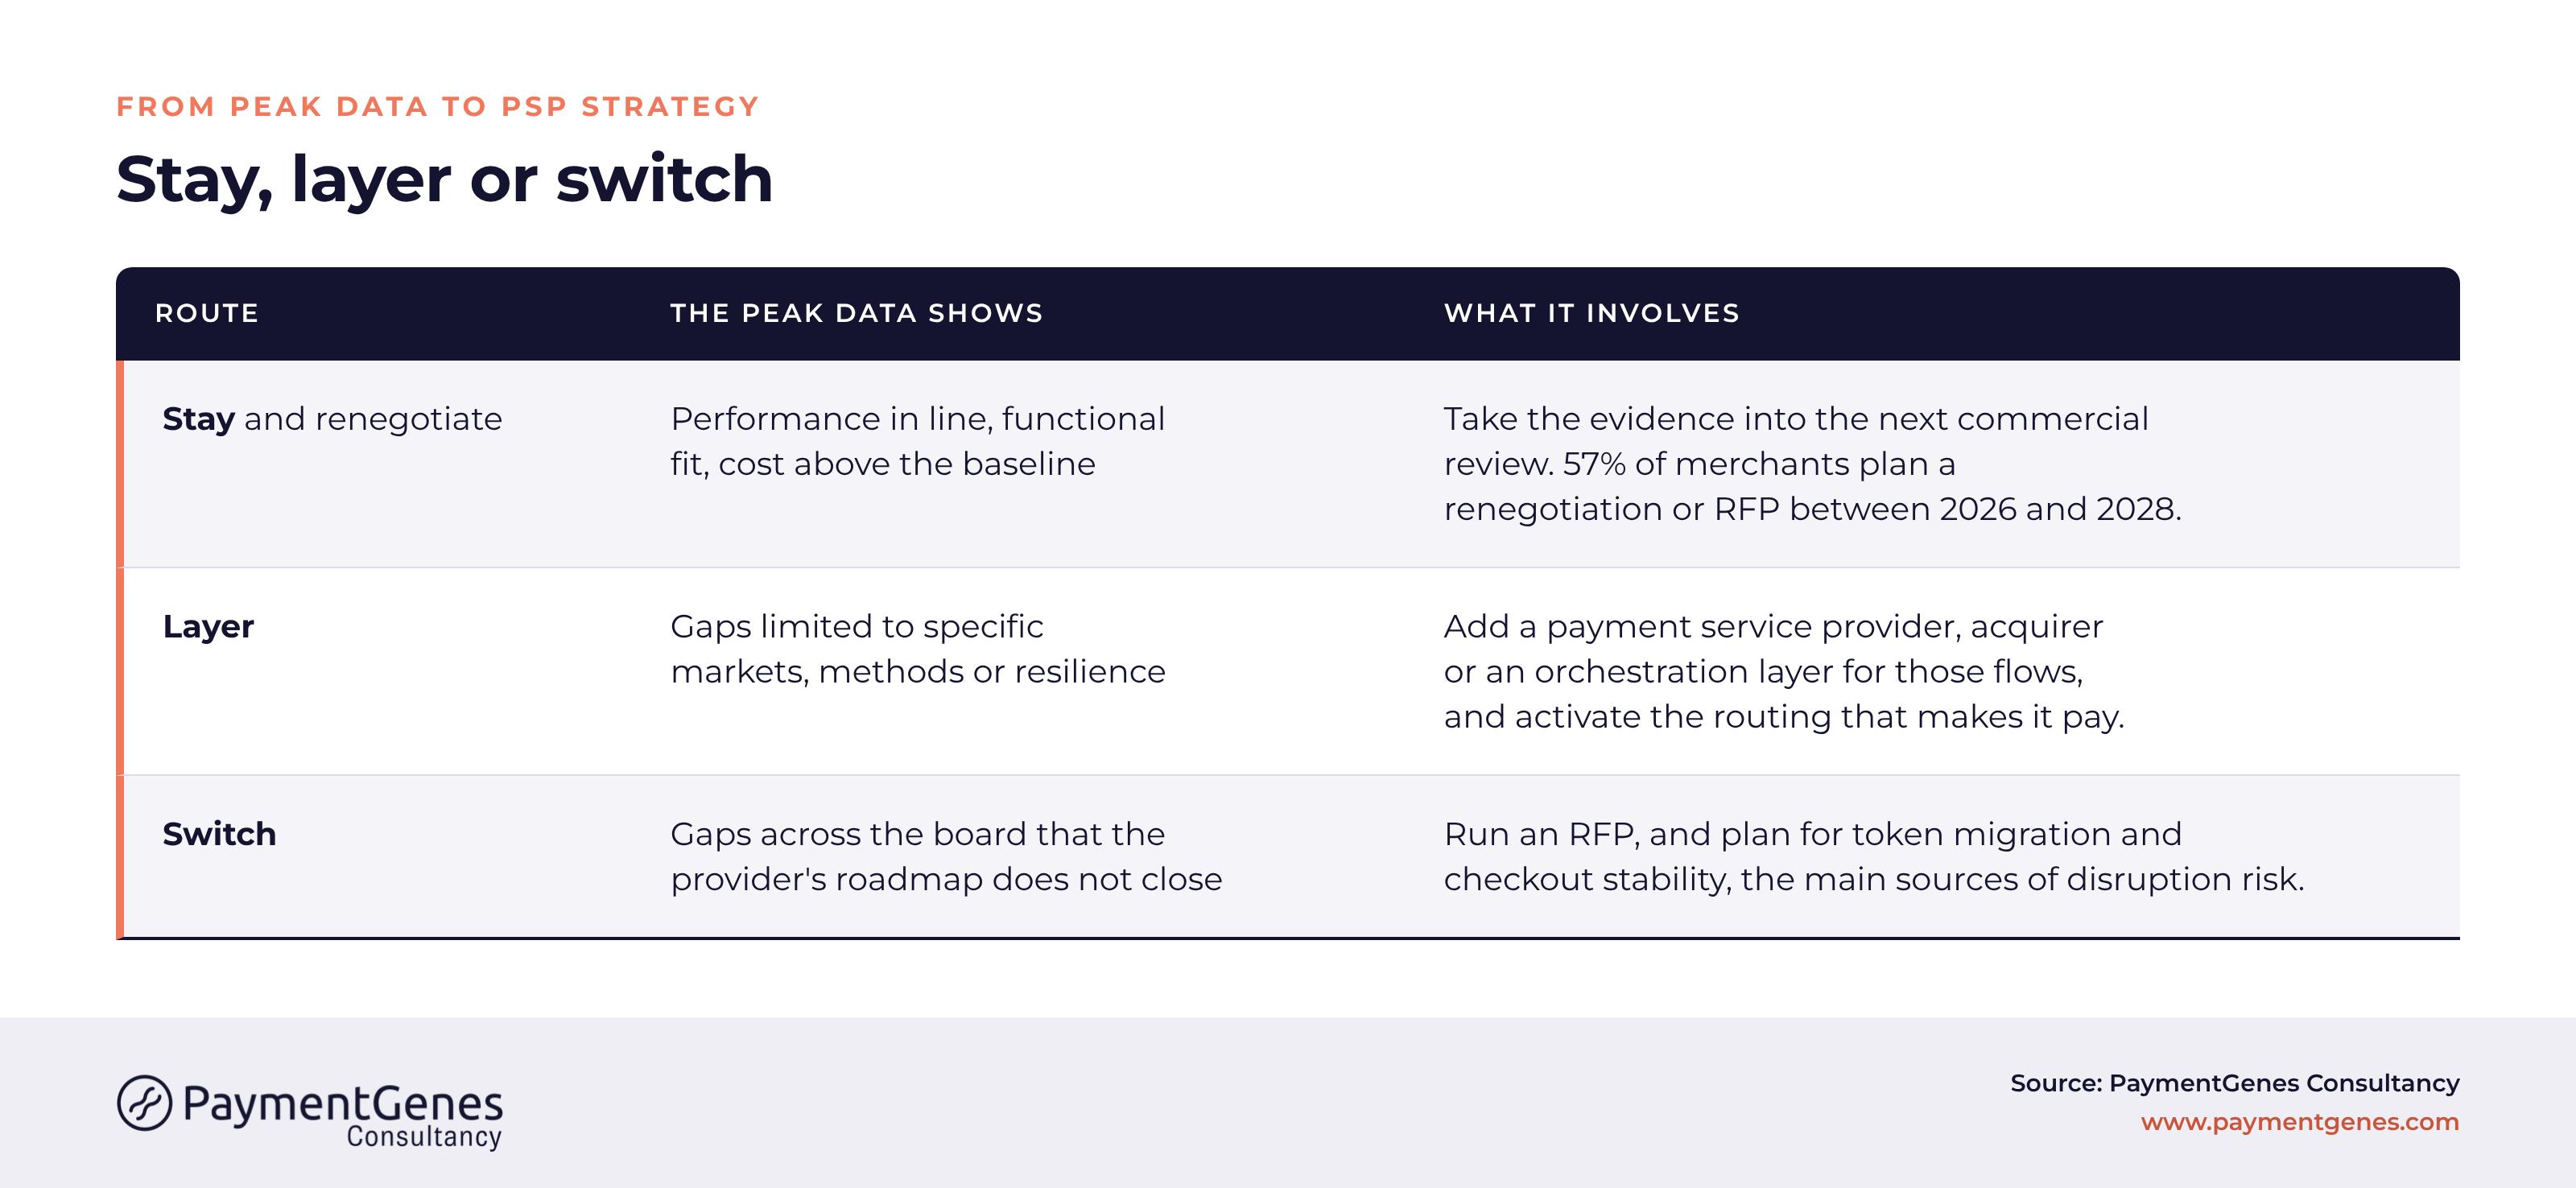
Run an RFP, and plan for token migration and checkout stability, the main sources of disruption risk.
Start with what is already paid for. Most enterprise merchants have moved beyond a single provider, but many carry the complexity of a multi-provider stack without collecting the return. For them, the first action is to switch on existing capability, not to buy more.
Decide early. Changes agreed in the first quarter can be live and tested before the next peak. Changes agreed after the summer typically run into the freeze on checkout changes that precedes it.
With a baseline, a value and a trigger, the choice to stay, switch or layer rests on the merchant's own data. So does the next commercial conversation with each provider.
Our team can help you define the five readings for your payment set-up, align the definitions across your providers, and assign an owner to each. When peak ends, the data is comparable and ready to use in your next commercial review.

Our team can help you define the five readings for your payment set-up, align the definitions across your providers, and assign an owner to each. When peak ends, the data is comparable and ready to use in your next commercial review.